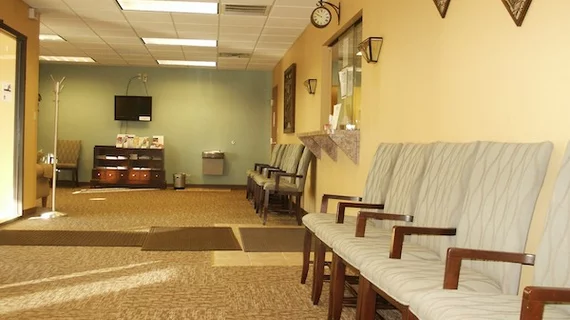
Traveling and waiting for healthcare services costs $89B each year
Getting to and waiting for a doctor’s appointment will likely take longer than getting a car repair, according to a recent analysis of travel and wait times among professional services by Altarum. All that waiting and traveling adds up to a significant burden in the U.S.–– an average of $89 billion annually in economic costs from 2006 to 2017.
Waiting times for healthcare services were twice as long as the next closest professional category, veterinary services, according to the analysis, which used data from the Bureau of Labor Statistics’ American Time Use Survey. In fact, traveling and waiting to see a healthcare professional totaled about 60 percent of the time of actually receiving care––an average of 45 minutes of traveling and waiting compared to 76 minutes of receiving care.
Worse still, efforts to improve travel and wait times in healthcare have not shown improvements from 2006 to 2017, according to the data. The impact is on both the healthcare system and patients, who forgo work, leisure or other activities to see a professional.
“Travel and wait times represent an important measure of quality as they are key metrics of patient experiences and the time burden of care is a known hurdle for individuals seeking access to medicine,” the report reads.
Travel and wait times
The report included office visits, inpatient treatment, dental care, physical therapy, psychologist visits, talking to a pharmacist, chiropractic care and acupuncture among the healthcare services in the category, as well as self-care and care for others.
Time spent receiving professional care only accounted for less than 25 percent of all health-related activities, as they occur less frequently than self-care. But the infrequent use of professional care takes a long time––76.3 minutes, with an average travel time of 34.3 minutes when professional care was received outside of the home. Waiting time was even longer––36.4 minutes on average.
The amount of time spent on health activities varied by age, sex and health status, and only occurred on 11 percent of days for the average American. People between the ages of 15 and 50 spent just 7 minutes per day treating their health, compared with those aged 50 and older, who spent an average of 16.9 minutes per day on health. Women spent almost twice as much time on their health daily compared to men––13.3 minutes vs. 7.9 minutes.
Those who reported poor health spend an average of 26.4 hours per month on healthcare activities, while those with excellent health reported dedicating just three hours.
Lost time
For patients, the time spent traveling and waiting for healthcare services is a lost opportunity and does nothing to improve health. Therefore, it is an opportunity for healthcare providers to make improvements.
For employed people, utilizing healthcare services with time spent traveling and waiting is associated with 90 fewer minutes spent working and 37 fewer minutes spent on leisure, the analysis found. For those unemployed, a similar day resulted in 74 fewer minutes of engaging in leisure. The average economic cost of travel and waiting was $89 billion annually from 2006 to 2017, based on hourly wage.

